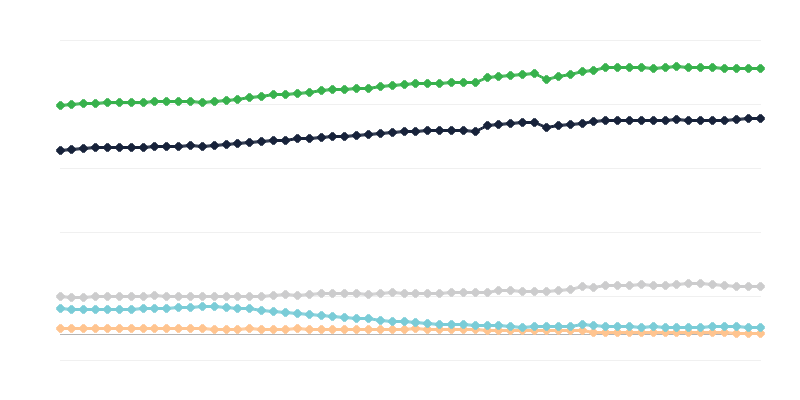
Order content

Employment in the Business Sector

Employment in the Business Sector – Chart

Percentage change in average employment in the business sector in Poland
Rok

Embed Code

Options

Chart type

Data

Chart Overview

In July 2025, compared to the previous month, the employment rate in the enterprise sector amounted to -0.9% (-0.1 p.p. m/m).

Additional Information

About the study

Study title: Employed in the National Economy

The purpose of the study is to provide information about employed individuals in Poland. Current, operational observation of occurring changes provides information about seasonal fluctuations in the number of employed, and long-term observations provide information about structural changes in the national economy. The study allows for determining the number, dynamics, and variety of employed individuals.

Definitions

Average Employment

The average level of employment calculated for the period under examination (e.g., month, quarter, year) based on employment records. Average employment in the study period includes both full-time and part-time workers converted to full-time equivalents.

Business Sector in Labor Market and Wage Statistics

Entities conducting economic activities classified according to NACE Rev. 2 in the following industries:

- Mining and quarrying (section B),

- Manufacturing (section C),

- Electricity, gas, steam and air conditioning supply (section D),

- Water supply; sewerage, waste management and remediation activities (section E),

- Construction (section F),

- Wholesale and retail trade; repair of motor vehicles and motorcycles (section G),

- Transportation and storage (section H),

- Accommodation and food service activities (section I),

- Information and communication (section J),

- Real estate activities (section L),

- Administrative and support service activities (section N).

How we process data

  1. We collect data directly from official government sources, most often via an API provided by the relevant statistical office. For this purpose, we use proprietary algorithms that retrieve and aggregate all information into our database.
  2. We standardize and clean the data for better analysis and readability. We remove unnecessary elements and adjust the structure to a unified format, which ensures consistency between different data sets. This enables visual interpretation of statistics as well as comparative analysis — both by humans and analytical systems (including artificial intelligence).
  3. We verify the information and design an interactive chart. We aim to make the information transparent and easy to understand, so we start with a presentation of general indicators that serve as a starting point for deeper data exploration. The user can then dive into the details using interactive chart features. We do not interfere with the content or meaning of the data — our role is solely to organize and facilitate access to the information.
  4. We create metadata and translate the chart into other languages. Each chart is supplemented with sources, survey details, and other information provided by the data supplier. We also use our own AI models to generate a short summary of the chart. Finally, we translate the content and publish the charts on 47 international Content Writer websites to share valuable information with the world.
  5. We regularly update and expand the data. Our scripts "listen" to data providers’ websites and retrieve the latest information as soon as updates appear. We then recreate the chart summary to reflect recent changes. The update is published, and interested users are informed about the current trend.

The data is processed by Content Writer — a limited liability company based in Poland — as part of the independent WorldIndex project. The initiative’s goal is to provide free access to current public data for analyzing trends and better understanding the world.

We also offer commercial access to the WorldIndex API, which provides direct access to data via an API. This allows companies, organizations, and individual users to integrate a real-time information stream into their applications, analytical systems, or AI models.

Data source

Data provider: Statistical Office in Bydgoszcz.

The source of the information is available at: https://api-dbw.stat.gov.pl/apidocs/index.html.

If you have detailed questions about the study, we encourage you to contact the data provider directly.

Embed This Chart on Your Website

Use trusted data sources that are regularly updated.

<iframe src="https://contentwriter.co.za/worldindex/poland/economy/labor-market/employment-in-the-business-sector/?template=embed-chart" width="100%" height="750" frameborder="0" style="border: none;"></iframe>

Chart Status

Verified

The chart was manually prepared and approved by our data analysts.

Up-to-date

The chart is connected to the data source, ensuring instant updates.

Available via API

You can use the above data in your applications via the Polish API data.

Get Insights That Matter

Subscribe to WorldIndex for Free

    Develop content faster than your competitors.