Order content

Prices of Consumer Goods and Services

Prices of Consumer Goods and Services – Chart

Percentage changes in the prices of goods and consumer services in Poland compared to the previous year
Rok

Embed Code

Options

Chart type

Data

Chart Overview

In 2024, compared to the previous year, the percentage change in consumer goods and services prices was 3.6% (-7.8 p.p. year-on-year).

Additional Information

About the study

Study title: Study on Prices of Goods and Consumer Services

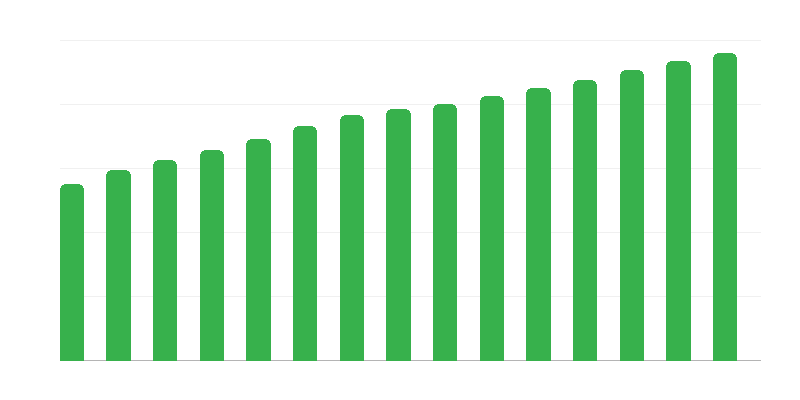
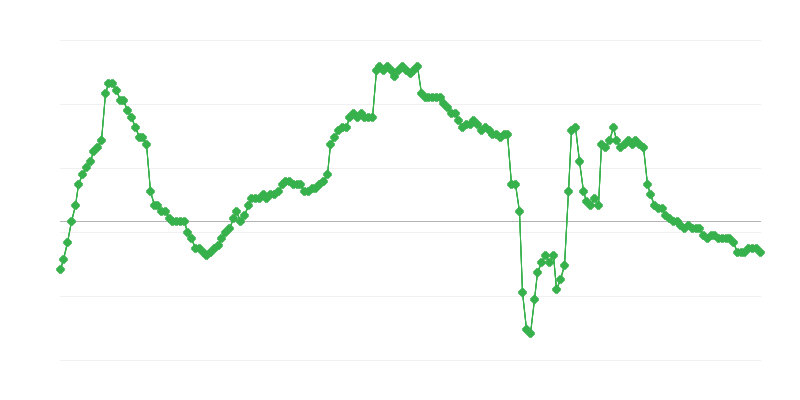
The purpose of the study is to provide information on the development of levels and dynamics of prices, their mutual relations, territorial diversity, information for analyses of economic and social phenomena, calculating household incomes in comparable price conditions, negotiations when concluding contracts, indexation of various economic magnitudes. Furthermore, the study provides information helpful in issuing court decisions and for calculating average monthly gross real wages. The study is also conducted for national accounts statistics and international organizations.

Definitions

Consumer Goods and Services Price Index

It is calculated based on the results of: - a survey of consumer goods and services prices in the retail market, - a survey of household budgets, providing data on average spending on consumer goods and services; this data is used to develop a weighting system. The European Classification of Individual Consumption by Purpose (ECOICOP, until 2013 — COICOP/HICP) is used to calculate the Consumer Goods and Services Price Index. The national price index of the representative being surveyed is calculated as a geometric average of price indices from all regions. Based on the price indices of representatives included in the price survey for a given group, using a geometric average, price indices of consumer goods and services groups at the lowest level of the weighting system aggregation are developed. They are then used, by applying the weighting system, to calculate indices at higher levels of aggregation, up to the overall Consumer Goods and Services Price Index. The price index is calculated according to the Laspeyres formula, using weights from the year preceding the surveyed year.

How we process data

  1. We collect data directly from official government sources, most often via an API provided by the relevant statistical office. For this purpose, we use proprietary algorithms that retrieve and aggregate all information into our database.
  2. We standardize and clean the data for better analysis and readability. We remove unnecessary elements and adjust the structure to a unified format, which ensures consistency between different data sets. This enables visual interpretation of statistics as well as comparative analysis — both by humans and analytical systems (including artificial intelligence).
  3. We verify the information and design an interactive chart. We aim to make the information transparent and easy to understand, so we start with a presentation of general indicators that serve as a starting point for deeper data exploration. The user can then dive into the details using interactive chart features. We do not interfere with the content or meaning of the data — our role is solely to organize and facilitate access to the information.
  4. We create metadata and translate the chart into other languages. Each chart is supplemented with sources, survey details, and other information provided by the data supplier. We also use our own AI models to generate a short summary of the chart. Finally, we translate the content and publish the charts on 47 international Content Writer websites to share valuable information with the world.
  5. We regularly update and expand the data. Our scripts "listen" to data providers’ websites and retrieve the latest information as soon as updates appear. We then recreate the chart summary to reflect recent changes. The update is published, and interested users are informed about the current trend.

The data is processed by Content Writer — a limited liability company based in Poland — as part of the independent WorldIndex project. The initiative’s goal is to provide free access to current public data for analyzing trends and better understanding the world.

We also offer commercial access to the WorldIndex API, which provides direct access to data via an API. This allows companies, organizations, and individual users to integrate a real-time information stream into their applications, analytical systems, or AI models.

Data source

Data provider: GUS – Department of Trade and Services.

The source of the information is available at: https://api-dbw.stat.gov.pl/apidocs/index.html.

If you have detailed questions about the study, we encourage you to contact the data provider directly.

Embed This Chart on Your Website

Use trusted data sources that are regularly updated.

<iframe src="https://contentwriter.co.za/worldindex/poland/economy/economic-climate/consumer-goods-and-services-prices/?template=embed-chart" width="100%" height="750" frameborder="0" style="border: none;"></iframe>

Chart Status

Verified

The chart was manually prepared and approved by our data analysts.

Up-to-date

The chart is connected to the data source, ensuring instant updates.

Available via API

You can use the above data in your applications via the Polish API data.

Get Insights That Matter

Subscribe to WorldIndex for Free

    Develop content faster than your competitors.